In Part – 1 , Part – 2 I went over basics of Day trading as well as some methods of selecting stocks to watch. In this post I am going to talk about some strategies for day trading. This is largely from the Day trading book by Andrew Aziz but I wanted to provide more useful insights here.
ABCD Strategy

The ABCD strategy is a classic price pattern used in day trading to identify and execute trades. The pattern is named after the four critical points it identifies on the price chart: A, B, C, and D. Here’s a simple breakdown of the ABCD pattern:
- Point A: This is the starting point, where the price begins its initial move upwards.
- Point B: After the price moves upwards from Point A, it will begin to retrace or pull back. Point B is where this retracement stops and is the highest point before the pullback.
- Point C: After reaching Point B, the price will pull back to a certain extent but not all the way to Point A. This stopping point of the pullback is Point C. Ideally, Point C should be higher than Point A, and this point often corresponds to a Fibonacci retracement level, such as the 38.2% or 61.8% level.
- Point D: After Point C, the price will again move upwards, ideally surpassing Point B. This continuation is considered the completion of the pattern, and Point D is where the price move is expected to end or where traders might take profit.
- Recognition: First and foremost, traders need to be able to identify the ABCD pattern on a price chart.
- Entry Point: Traders might consider entering a long trade at or near Point C, betting on the price to rise and continue its upward movement.
- Stop Loss: A stop loss can be set below Point C. If the price goes below this level, it suggests the pattern is not playing out as expected, and it may be best to cut losses.
- Take Profit: The target or take profit point can be set at Point D, or traders might use tools like Fibonacci extensions to identify potential target levels beyond Point D.
Bull flag momentum pattern
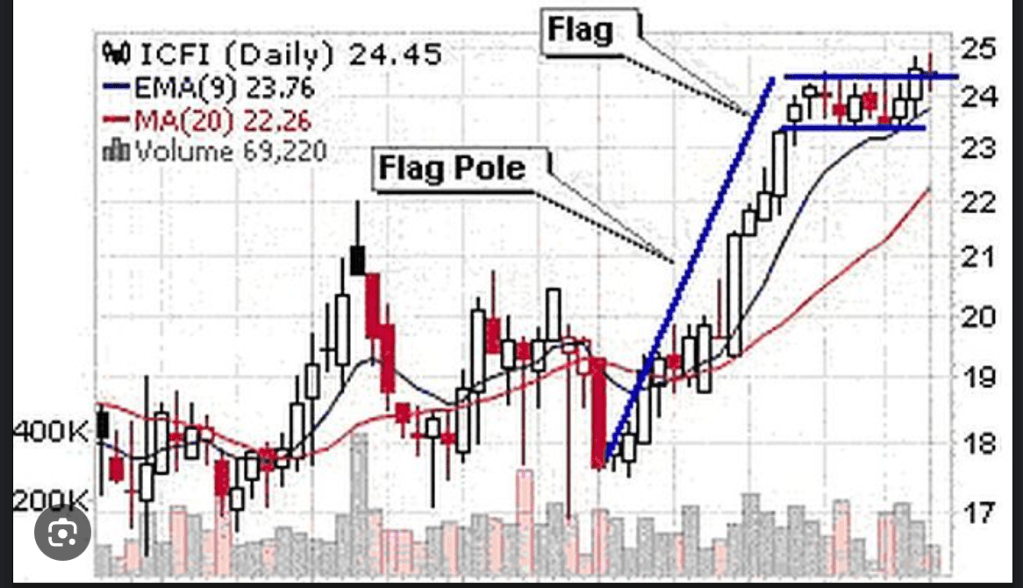
The “bull flag” is a popular and frequently occurring chart pattern in technical analysis. It’s a continuation pattern that signals a short pause or consolidation in a dominant uptrend, followed by a breakout and continuation of that trend. The pattern resembles a flag on a flagpole, with the “pole” representing a strong bullish (upward) move and the “flag” being the consolidation that follows.
How to Identify a Bull Flag Pattern:
- Flag Pole: This is the initial strong upward move. The stronger and steeper this move, the more pronounced the pole will be. This sharp climb signifies strong buying interest.
- Flag: After the steep upward move, the price starts to consolidate, forming a rectangular shape. The consolidation can be horizontal (more common) or tilted downwards. It’s essential that the consolidation doesn’t retrace too much of the flagpole; otherwise, it might not be considered a bull flag.
- Volume: Typically, volume is high during the formation of the flagpole and tends to diminish during the flag consolidation. This decreasing volume indicates a pause in momentum, not a trend reversal.
- Entry Point: An entry is considered once the price breaks out of the flag pattern, signaling a continuation of the previous bullish trend. This breakout should ideally be on increased volume, confirming the strength of the move.
- Stop Loss: It’s common to place a stop loss just below the bottom of the flag or at a point within the flag where a reversal is confirmed. This ensures minimal losses if the pattern fails.
- Profit Target: The projected move after the breakout is typically equal to the length of the flagpole. For instance, if the flagpole is 10 points tall, you’d expect a 10 point move upward from the top of the flag.
Reversal Trading
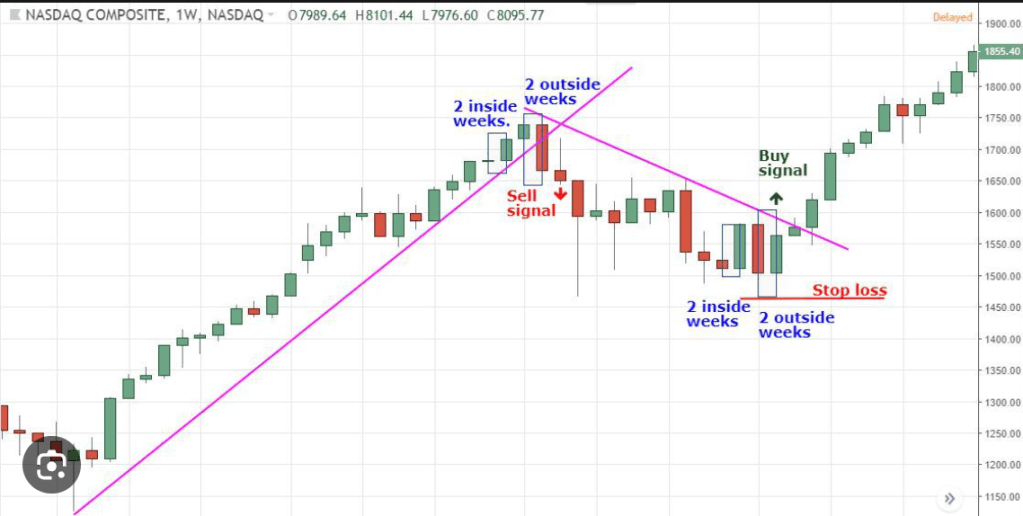
Reversal trading, also known as counter-trend trading, is a strategy used by day traders to capitalize on expected changes in a current price trend. Essentially, traders aim to enter the market just as the price is about to change direction.
Key Concepts in Reversal Trading:
- Reversals: A reversal indicates a change in the direction of a price trend. This can be from an uptrend to a downtrend or vice versa.
- Tops and Bottoms: In reversal trading, you’re primarily looking for ‘tops’ (peaks in price where a reversal from an uptrend to a downtrend might happen) and ‘bottoms’ (troughs in price where a reversal from a downtrend to an uptrend might happen).
Basic Steps in Reversal Trading:
- Identify Overbought or Oversold Conditions: Using tools like the Relative Strength Index (RSI) or the Stochastic Oscillator can help spot when an asset is overbought (potentially overvalued) or oversold (potentially undervalued), indicating a potential reversal. RSI > 90 mean overbought and RSI < 10 means oversold.
- Look for Price Action Confirmation: Patterns like double tops, double bottoms, head and shoulders, or candlestick patterns (like hammer and shooting star) can hint at an imminent reversal.
- Entry Point: Once you believe a reversal is imminent, you’ll enter the trade. If you’re anticipating a downtrend, you’d short sell, and if you’re expecting an uptrend, you’d buy.
- Set Stop-Loss and Take-Profit: Given the inherent risk in predicting reversals, it’s vital to have a stop-loss in place. Your take-profit point is where you expect the price to reach after the reversal.
- Monitor and Adjust: Keep a close eye on the trade and adjust your strategy based on the evolving price action and market conditions.
Basically look for stocks with 4 or more consecutive candlesticks going downward in an extreme manner, Then wait for an indecision candlestick, RSI < 10 or being trading at or near significant intraday support level. Buy when you see the stock make a new 1 minute or 5 minute high.
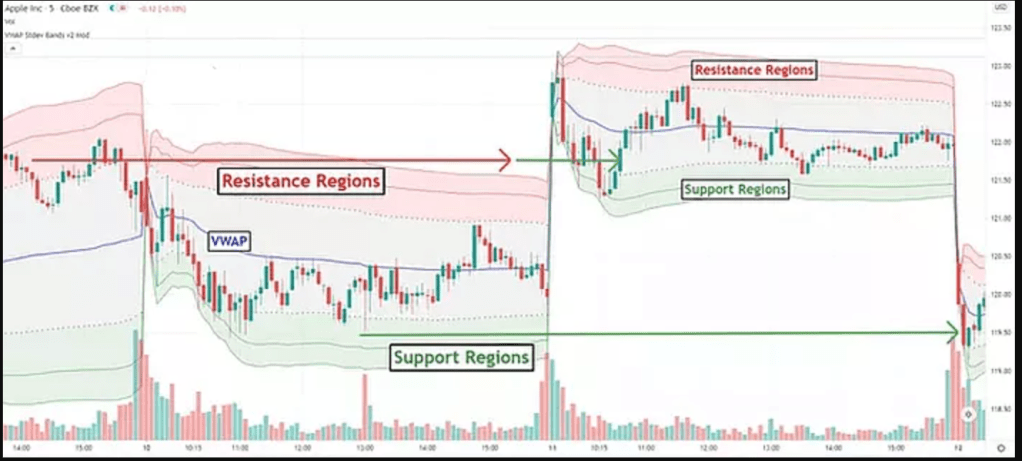
Volume Weighted average price
The Volume Weighted Average Price (VWAP) is a trading benchmark used by traders that gives the average price a security has traded at throughout the day, based on both volume and price. It is essential in understanding whether a security is being bought or sold at a good value.
Here’s how it works: instead of just averaging the prices of a stock throughout the day (like a simple moving average would), VWAP multiplies the price by the volume of shares traded at that price and then divides by the total shares traded for the day. This way, larger trades (in terms of volume) have a bigger impact on the average price. Traders use VWAP to determine market direction and to identify potential buying or selling opportunities. If a stock price is above its VWAP, it may be considered undervalued, suggesting potential buying interest. Conversely, if it’s below the VWAP, it may be seen as overvalued, signaling potential selling interest. To use VWAP effectively, traders should consider it in conjunction with other indicators and tools, and remember that while it provides a useful benchmark, it’s not a standalone guarantee of a good trade.
Happy investing!
Disclaimer: The information provided here is for general informational purposes only and should not be considered as professional financial or investment advice. Before making any financial decisions, including investments, it is essential to seek advice from a qualified financial advisor or professional.

Leave a comment