Bonds are a popular type of investment that individuals and organizations use to raise funds for various purposes. When you buy a bond, you’re essentially lending money to the issuer, who agrees to pay you interest (coupon) at regular intervals and return the principal amount (face value) when the bond matures. The bond pricing model helps determine the fair value of a bond by considering factors such as the coupon rate, time to maturity, and prevailing interest rates.
One of the crucial aspects of bond investing is understanding bond yields, which represent the annualized return you earn from holding the bond. The yield to maturity is a comprehensive measure of the bond’s overall return, taking into account its price, coupon payments, and time to maturity. The formula for calculating the yield to maturity might seem a bit intimidating at first: YTM = [(C + (F – P) / n) / ((F + P) / 2)]. However, don’t worry too much about the formula itself; what matters is knowing that yield to maturity considers all potential cash flows from the bond until it matures, giving you a more accurate understanding of its profitability. By grasping these fundamental bond concepts, you’ll be better equipped to make informed investment decisions and navigate the world of bonds more confidently.
The formula for calculating the fair price of a bond is as follows:
Fair Bond Price = ∑ [C / (1 + r)^t] + (F / (1 + r)^n)Where:
- C is the periodic coupon payment (usually annual) received from the bond.
- r is the required rate of return (yield) that an investor demands for holding the bond. This is also known as the discount rate or yield to maturity.
- t represents the time period (number of years) from the present until each coupon payment is received.
- F is the face value or par value of the bond, which is the principal amount that will be repaid at maturity.
- n is the total number of time periods (number of years) until the bond matures.
This formula calculates the present value of all future coupon payments and the face value, discounted at the required rate of return. The sum of these discounted cash flows represents the fair price of the bond, which should be equal to the current market price if the bond is trading at its fair value.
Yield curves
A yield curve is a graphical representation that shows the relationship between the yields, or interest rates, of bonds with different maturities. It illustrates the interest rates for bonds of varying timeframes, typically ranging from short-term to long-term.
In a yield curve, the x-axis represents the time to maturity of the bonds, while the y-axis represents the corresponding yields or interest rates. The shape of the yield curve can provide valuable insights into the current and future state of an economy.
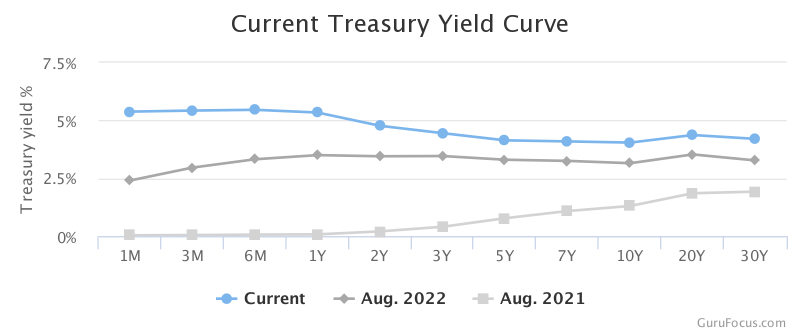
The three main types of yield curves are:
- Normal Yield Curve: This is the most common shape of the yield curve, where longer-term bonds have higher yields compared to shorter-term bonds. It reflects a healthy and growing economy. Investors expect higher returns for locking their money into longer-term investments, and this upward-sloping curve indicates that they are compensated with higher yields.
- Inverted Yield Curve: An inverted yield curve occurs when short-term yields are higher than long-term yields. It is often seen as a warning sign of an impending economic downturn. Investors might anticipate lower interest rates in the future due to weakening economic conditions, leading to increased demand for long-term bonds and consequently driving down long-term yields.
- Flat or Humped Yield Curve: This type of yield curve shows little difference in yields across various maturities. It typically occurs during transitional periods in the economy when uncertainty about its direction exists. Investors are uncertain about the future and are unwilling to commit to either short-term or long-term investments.
Yield curves are essential tools for economists, policymakers, and investors. They provide information about market expectations, inflation, monetary policy, and overall economic health. Central banks, for instance, closely monitor yield curves to assess the monetary stance and adjust interest rates accordingly to manage inflation and economic growth.
Furthermore, yield curve analysis can help investors make decisions about their portfolios. An inverted yield curve may signal an upcoming recession, leading investors to adjust their asset allocation towards safer investments. On the other hand, a normal or steepening yield curve may indicate an improving economy, encouraging investors to take on more risk.
In summary, the yield curve is a valuable indicator that illustrates the relationship between bond yields and maturities, providing crucial insights into the current and future economic conditions. Its analysis can inform various stakeholders about the economic landscape and influence their financial decisions.
Bonds and Yield curve mechanics are two very important concepts to understand the macroeconomic context as a whole. A question is how to use this knowledge to optimize your portfolio.
Bond Duration
Duration and Interest Rate Sensitivity: Bond duration measures how sensitive a bond’s price is to changes in interest rates. The formula for Macaulay duration is: Macaulay
Duration = (C₁ * T₁ + C₂ * T₂ + ... + Cn * Tn) / Current Bond PriceWhere C₁, C₂, …, Cn are the cash flows (coupon payments and face value) at time periods T₁, T₂, …, Tn. Duration is expressed in years and represents the weighted average time to receive the bond’s cash flows.
Portfolio optimization
Portfolio optimization involves finding the ideal mix of assets to achieve the highest return for a given level of risk. Including bonds in a portfolio can enhance diversification, lower overall risk, and potentially increase returns.
- Correlation: The correlation between different assets in a portfolio affects its overall risk. Bonds usually have low or negative correlations with stocks, making them valuable for diversification.
- Risk-Free Rate: The risk-free rate represents the return on a risk-free investment, like a government bond. It is used as the baseline return in portfolio optimization calculations.
When stocks experience volatility, bonds tend to perform better, providing a hedge against market risk. Investors can allocate a portion of their portfolio to bonds, reducing overall portfolio risk.
- Duration Matching: To hedge interest rate risk, investors can match the duration of their bond portfolio with their investment horizon. By doing so, the impact of interest rate changes on the bond portfolio can be minimized.
The most popular types of bonds that I like to buy are US Treasuries. I will make a separate detailed followup posts on US treasuries and a step by step on how you can buy them. Stay tuned!
Happy Investing!
Disclaimer: The information provided here is for general informational purposes only and should not be considered as professional financial or investment advice. Before making any financial decisions, including investments, it is essential to seek advice from a qualified financial advisor or professional.

Leave a comment